


More Spin From RSB
 11-24-2008 | 02:47 PM
#1
Thread Starter
Nontypical Buck
Joined: Apr 2008
Posts: 3,879
Likes: 0
Here is some antlerless harvest data RSB provided along with his usual spin that the habitat is limiting the deer herd instead of the high antlerless allocations and harvests.
There has been so much talk about how the high doe harvests the past few years have ruined hunting in so many areas of Pennsylvania I decided to do some comparison research on the subject. With the method of deer management having changed in the past five years or so it has been hard for hunters to take an objective look at the harvests of today compared to the past because harvests are no longer provided by county and instead are only expressed by wildlife management unit. Most hunters believe that the harvests for their hunting area have been higher since the advent of concurrent buck/doe seasons and larger wildlife management units. The facts just don’t support that belief for many areas of the state though.
To make the antler less deer harvest history comparable from the days of county allocations and the three day antler less seasons comparable to the concurrent seasons, by WMU, I took each county that makes up the WMU, combined their annual harvests, for each year into five year averages, and then divided it by the total square miles of land within the counties. That then makes the historic county doe harvest data comparable with the present day harvest data for the WMUs.
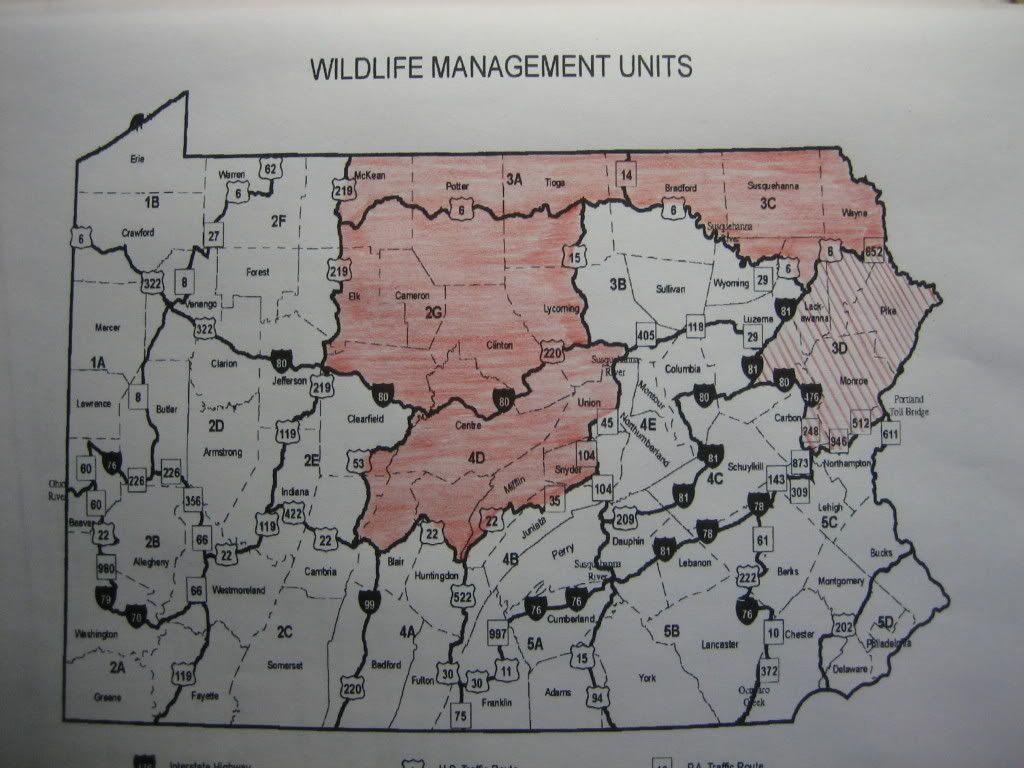
I found that many of the northern tier, mountainous and typically poor soil area units had their highest doe harvests per square mile between fifteen and twenty years ago. In many of those unit’s the doe harvest since the concurrent seasons have been the lowest in the twenty five years and even longer. I am going to post a map of the WMUs with the units that had their highest harvests fifteen to twenty years ago shaded in red. One unit (3D) is just lined with red lines because the high harvest there was the period ten to fifteen years ago.
Here are the harvest history results to go with the WMU map based on antler less harvests pre square mile for each time period with the highest harvest period indicated in red. I am also going to include the statewide averages here just for comparison purposes.
Unit………………83-87.…………..88-92.………….93-97.…………….98-02.…………….03-07(WMU)
2G………………..3.98.……………5.48.… …………4.36.………………4.66.………� ��……2.35
3A………………..4.80.……………6.52.… …………5.39.………………6.08.………� ��……6.07
3C………………..3.59.……………6.22.… …………5.36.………………6.11.………� ��……5.49
4D………………..3.39.……………5.25.… …………4.41.………………4.90.………� ��……4.03
3D………………..2.77.……………3.99.… …………4.33.………………4.32.………� ��……4.09
Statewide………..3.30.…………….4.93.…� ��………5.07.………………5.81.………� �……5.66
I would think it to be kind of hard to blame today’s low deer numbers on the high antler less harvests since the fact is that the high harvest years occurred between fifteen and twenty years ago. Given the fact that the white-tail deer is capable of nearly doubling its numbers every year where it has quality habitat is should be obvious that what is causing low deer numbers in the red areas of the state is more habitat and environmental conditions related then harvest related. I pretty much fail to see how anyone could even deny that fact since it is so obvious based on the antler less harvest history facts.
Now lets look at a map that not only has the red areas with the highest harvests having been fifteen to twenty years ago but also the blue WMUs where the highest antler less harvests have occurred with the past five years.
What he fails to explain is how the habitat that was over browsed for 50 years allowed the herd to increase so it could sustain a harvest of over 4.36 antlerless PSM from 1988 to 2002, but the same habitat in 2003-2007 could only support a herd that produced a harvest of only 2.35 antlerless PSM. His theory simply makes no sense and it never did. Worse yet ,it contradicts everything that the PGC experts have been telling us regarding the effects of the antlerless harvests beginning in 2000.
There has been so much talk about how the high doe harvests the past few years have ruined hunting in so many areas of Pennsylvania I decided to do some comparison research on the subject. With the method of deer management having changed in the past five years or so it has been hard for hunters to take an objective look at the harvests of today compared to the past because harvests are no longer provided by county and instead are only expressed by wildlife management unit. Most hunters believe that the harvests for their hunting area have been higher since the advent of concurrent buck/doe seasons and larger wildlife management units. The facts just don’t support that belief for many areas of the state though.
To make the antler less deer harvest history comparable from the days of county allocations and the three day antler less seasons comparable to the concurrent seasons, by WMU, I took each county that makes up the WMU, combined their annual harvests, for each year into five year averages, and then divided it by the total square miles of land within the counties. That then makes the historic county doe harvest data comparable with the present day harvest data for the WMUs.
I found that many of the northern tier, mountainous and typically poor soil area units had their highest doe harvests per square mile between fifteen and twenty years ago. In many of those unit’s the doe harvest since the concurrent seasons have been the lowest in the twenty five years and even longer. I am going to post a map of the WMUs with the units that had their highest harvests fifteen to twenty years ago shaded in red. One unit (3D) is just lined with red lines because the high harvest there was the period ten to fifteen years ago.
Here are the harvest history results to go with the WMU map based on antler less harvests pre square mile for each time period with the highest harvest period indicated in red. I am also going to include the statewide averages here just for comparison purposes.
Unit………………83-87.…………..88-92.………….93-97.…………….98-02.…………….03-07(WMU)
2G………………..3.98.……………5.48.… …………4.36.………………4.66.………� ��……2.35
3A………………..4.80.……………6.52.… …………5.39.………………6.08.………� ��……6.07
3C………………..3.59.……………6.22.… …………5.36.………………6.11.………� ��……5.49
4D………………..3.39.……………5.25.… …………4.41.………………4.90.………� ��……4.03
3D………………..2.77.……………3.99.… …………4.33.………………4.32.………� ��……4.09
Statewide………..3.30.…………….4.93.…� ��………5.07.………………5.81.………� �……5.66
I would think it to be kind of hard to blame today’s low deer numbers on the high antler less harvests since the fact is that the high harvest years occurred between fifteen and twenty years ago. Given the fact that the white-tail deer is capable of nearly doubling its numbers every year where it has quality habitat is should be obvious that what is causing low deer numbers in the red areas of the state is more habitat and environmental conditions related then harvest related. I pretty much fail to see how anyone could even deny that fact since it is so obvious based on the antler less harvest history facts.
Now lets look at a map that not only has the red areas with the highest harvests having been fifteen to twenty years ago but also the blue WMUs where the highest antler less harvests have occurred with the past five years.
 11-24-2008 | 08:16 PM
#2
Fork Horn
Joined: Sep 2008
Posts: 147
Likes: 0
Why didn’t you post all of the information? didn’t the rest of it fit your misguided agenda?
That is ok though, we pretty much expect that from you.
Here is the rest of the information.
There has been so much talk about how the high doe harvests the past few years have ruined hunting in so many areas of Pennsylvania I decided to do some comparison research on the subject. With the method of deer management having changed in the past five years or so it has been hard for hunters to take an objective look at the harvests of today compared to the past because harvests are no longer provided by county and instead are only expressed by wildlife management unit. Most hunters believe that the harvests for their hunting area have been higher since the advent of concurrent buck/doe seasons and larger wildlife management units. The facts just don’t support that belief for many areas of the state though.
To make the antler less deer harvest history comparable from the days of county allocations and the three day antler less seasons comparable to the concurrent seasons, by WMU, I took each county that makes up the WMU, combined their annual harvests, for each year into five year averages, and then divided it by the total square miles of land within the counties. That then makes the historic county doe harvest data comparable with the present day harvest data for the WMUs.
I found that many of the northern tier, mountainous and typically poor soil area units had their highest doe harvests per square mile between fifteen and twenty years ago. In many of those unit’s the doe harvest since the concurrent seasons have been the lowest in the twenty five years and even longer. I am going to post a map of the WMUs with the units that had their highest harvests fifteen to twenty years ago shaded in red. One unit (3D) is just lined with red lines because the high harvest there was the period ten to fifteen years ago.
http://i151.photobucket.com/albums/s141/RBODENHORN/096.jpg
Here are the harvest history results to go with the WMU map based on antler less harvests pre square mile for each time period with the highest harvest period indicated in red. I am also going to include the statewide averages here just for comparison purposes.
Unit………………83-87.…………..88-92.………….93-97.…………….98-02.…………….03-07(WMU)
2G………………..3.98.……………5.48.……………4.36.………………4.66.…… …………2.35
3A………………..4.80.……………6.52.……………5.39.………………6.08.…… …………6.07
3C………………..3.59.……………6.22.……………5.36.………………6.11.…… …………5.49
4D………………..3.39.……………5.25.……………4.41.………………4.90.…… …………4.03
3D………………..2.77.……………3.99.… …………4.33.………………4.32.………………4.09
Statewide………..3.30.…………….4.93.…� ��………5.07.………………5.81.………………5.66
I would think it to be kind of hard to blame today’s low deer numbers on the high antler less harvests since the fact is that the high harvest years occurred between fifteen and twenty years ago. Given the fact that the white-tail deer is capable of nearly doubling its numbers every year where it has quality habitat is should be obvious that what is causing low deer numbers in the red areas of the state is more habitat and environmental conditions related then harvest related. I pretty much fail to see how anyone could even deny that fact since it is so obvious based on the antler less harvest history facts.
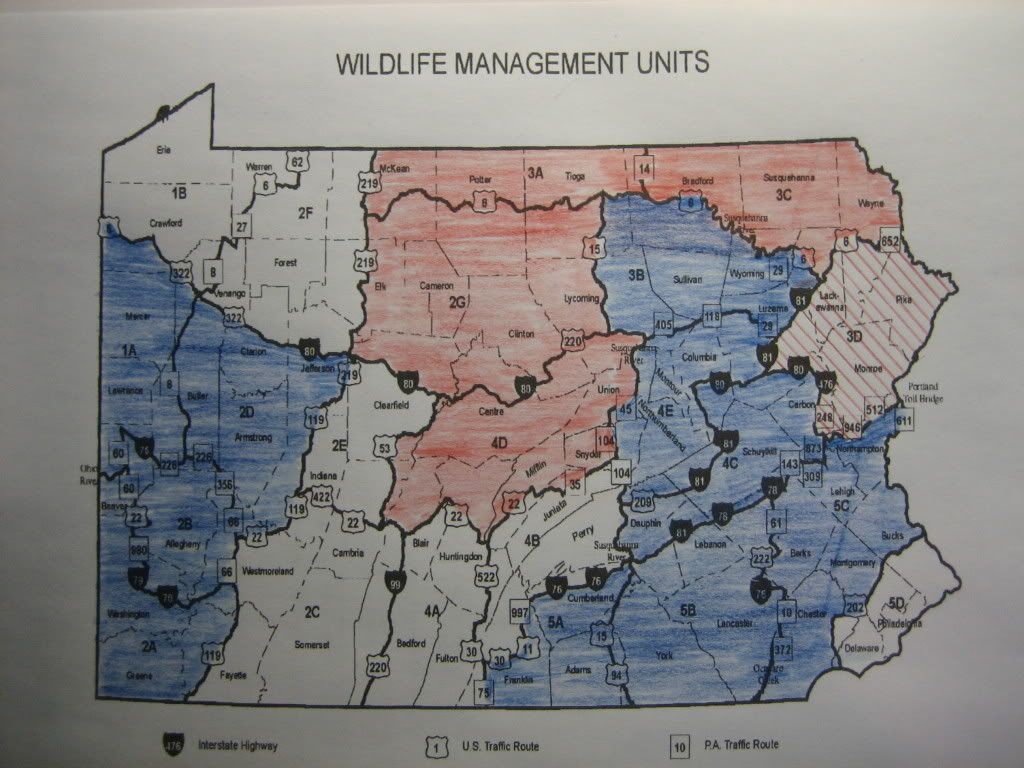
Now lets look at a map that not only has the red areas with the highest harvests having been fifteen to twenty years ago but also the blue WMUs where the highest antler less harvests have occurred with the past five years.
http://i151.photobucket.com/albums/s141/RBODENHORN/097.jpg
This should make it pretty clear that the majority of the recent high antler less harvests have come from the richer soil areas of the state and where adverse winter affects on the deer are not as much a factor.
I am also going to include the harvest history for those blue WMUs so people can see the harvest history in those five year averages.
Unit………………83-87.…………..88-92.………….93-97.…………….98-02.…………….03-07(WMU)
1A………………..3.11.……………4.96.… …………5.93.………………7.18.………� ��……7.65
2A………………..3.34.……………5.67.… …………6.85.………………8.14.………� ��……9.49
2B………………..2.73.……………4.98.… …………6.57.………………8.39.………� ��…..10.70
2D………………..4.70.……………6.14.… …………6.97.………………8.26.………� ��……8.53
3B………………..3.68.……………5.36.… …………4.78.………………5.15.………� ��……6.07
4C………………..3.31.……………4.77.… …………4.89.………………5.53.………� ��……5.94
4E………………..3.27.……………4.74.… …………4.39.………………4.94.………� ��……5.68
5A………………..1.94.……………3.54.… …………3.53.………………4.20.………� ��……4.42
5B………………..2.23.……………3.51.… …………3.96.………………4.71.………� ��……4.84
5C………………..2.12.……………3.69.… …………5.08.………………5.84.………� ��……7.94
I think it is interesting to note that some of these units have unlimited antler less license allocations and have had for about the past fifteen years and in spite of their antler less harvests consistently increasing their deer numbers are still high and obviously sustainable at the higher harvests that have occurred. Other units in this group have had comparatively lower harvests that still seem to be sustainable at those slightly increased harvests that have occurred the past five years.
Perhaps some of those areas also have fewer deer today, but that was really the intended affect for many areas. The reduced deer numbers was planned to better match the deer numbers with their food supply, but I don’t see any major harvest increases in any of the units as compared to what the harvests had been when the same areas were managed as county units.
The white, uncolored areas, of the of the map are the areas where the highest antler less deer harvests occurred between five and ten years ago. Even the locations of those units likely tells a story about the soils, habitat conditions and winter influence on the present deer numbers. I find it interesting that the colors pretty much all seem to fit patterns of habitat types with the exception of unit 5D which is kind of a totally different story altogether. Unit 5D is mostly city and highly residential with like habitat for deer and an area with unlimited antler less harvests. It is also possible that between the lose of habitat and increased hunter harvests unit 5D might actually have experienced a slight population reduction even though the harvest data indicates just a very slight reduction.
Now the harvest history for the white areas where the highest antler less harvests were five to ten years ago.
Unit………………83-87.…………..88-92.………….93-97.…………….98-02.…………….03-07(WMU)
1B………………..3.86.……………5.91.… …………6.39.………………7.43.………� ��……5.96
2C….…………….3.21.……………5.07.… …………5.42.………………6.38.………� ��……5.31
2E………………..3.84.……………6.14.… …………6.04.………………6.70.………� ��……6.43
2F………………..4.63.……………5.87.… …………5.99.………………6.23.………� ��……4.50
4A………………..3.15.……………5.02.… …………4.90.………………5.90.………� ��……5.21
4B………………..2.76.……………4.61.… …………4.50.………………5.33.………� ��……4.94
5D………………..1.43.……………2.69.… …………5.05.………………5.30.………� ��……5.27
Based on the fact that the harvests in most of these units has been the equivalent the past five years as to what they had been during the ten year between the mid eighties and nineties when most people believe we had our best hunting years then we have to really wonder why the deer numbers of today are lower then back then. Once again remember we are talking about a species that can nearly double its numbers every year when they have suitable habitat and conditions.
I think this is just one more piece of evidence that clearly proves that the environmental factors are having more influence on today’s deer numbers then hunter harvests have had. Some, probably many, will disagree with me about that theory but, realistically that seems to be the direction all of the real evidence leads use. Many will reject that concept simply because it isn’t what they want to believe even when the evidence is continuously becoming more convincing to those willing to objectively review the evidence.
R.S Bodenhorn
11-24-2008 | 08:56 PM
#3
Thread Starter
Nontypical Buck
Joined: Apr 2008
Posts: 3,879
Likes: 0
Why didn’t you post all of the information? didn’t the rest of it fit your misguided agenda?
11-24-2008 | 09:54 PM
#6
Fork Horn
Joined: Sep 2008
Posts: 147
Likes: 0
ORIGINAL: bluebird2
Because it was just as meaningless and irrelevant as the rest of the data you posted. IMHO it is simply outrageous for an employee of the PGC to portray the deer management personnel of the PGC as liars for claiming the antlerless harvests have reduced the herd, while you claim that environmental factors are actually controlling the herd. You claim to support scientific deer management while denying the very basic principle that antlerless harvests are used to control the herd and the antlerless allocations determine the antlerless harvest.
Why didn’t you post all of the information? didn’t the rest of it fit your misguided agenda?
Why I would guess that anyone that has a lick of commonsense would look at the harvest FACTS as evidence. In this case the FACTS, or evidence, very clearly prove that hunters have NOT harvested anyway near as many deer in units like 2G, and those other red areas, in recent times as they were fifteen to twenty years ago.
I believe those facts pretty much shot a huge hole in your nonsense theories about how the low deer numbers of today is because hunters over harvested the deer though. After all the high doe harvests occurred fifteen to twenty years ago instead of during recent times.
I don’t believe I have called anyone in the Game Commission a liar either, though I might very well point out something others hadn’t realized on an occasion or two. Sometimes other people within the agency do tend to worry about being more politically correct with their statements then I think they should be. I tend to just tell the real truth instead of telling people what they like to hear or what is politically correct.
The fact is that the real evidence just keeps mounting that the deer numbers are much more controlled by the environmental factors then they are by the hunter harvests in many if not most areas of the state. Of course hunters still play a huge role in the total picture, especially when and wherethey fail to harvest enough deer to keep the deernumbers within the limits of their habitat and food supply.
The evidence pretty clearly proves that the most assured way to have fewer deer in the future is to try keeping more deer then the habitat can long term sustain. That facts say that if the deer herd could have increased from harvesting fewer deer it surely would have done so after fifteen to twenty years of lower doe harvests. After all deer living in suitable habitat can very nearly double their own numbers each and every year. If they aren’t then there is something very wrong besides just hunters harvesting deer, especially when the population keeps declining following reduced doe harvests. Even the village idiot should be able to figure that out.
R.S. Bodenhorn
11-24-2008 | 10:18 PM
#9
Fork Horn
Joined: Sep 2008
Posts: 227
Likes: 0
ORIGINAL: RSB
Do you have anything of substance to contribute or just wisecracks?
R.S. Bodenhorn
ORIGINAL: Coalcracker
I think he's SPINNING counter clockwise.
I think he's SPINNING counter clockwise.
Do you have anything of substance to contribute or just wisecracks?
R.S. Bodenhorn
When the forest regenerated after the massive timbering, we had few deer and a lot of browse, so they had to stock deer from out of state. The browsing stage can support a lot of deer, but only for around 15 years, then it goes to pole timber, which can support the least deer. Oaks start to produce mast crop (which is considered browse, by the way) after around 30 years of age, which blows your theory right out of the water, as the forest has been the same for almost 70 years.
That means the antlerless deer allocation is responsible for the decrease in the deer numbers. But those of us that have been reading your posts over the last few years, know that you want to keep the herd at levels when the mass crop is poor.
11-24-2008 | 10:20 PM
#10
Fork Horn
Joined: Sep 2008
Posts: 227
Likes: 0
ORIGINAL: livbucks
A major factor is that the forest matured and now there is not the unlimited amount of browse like years ago.
A major factor is that the forest matured and now there is not the unlimited amount of browse like years ago.