Here are some data plots based on individual reports. I may have missed some data(?), as I found~183 inches difference in the totals between the scores for each team vs scores reported in the "photo" section. -fsh
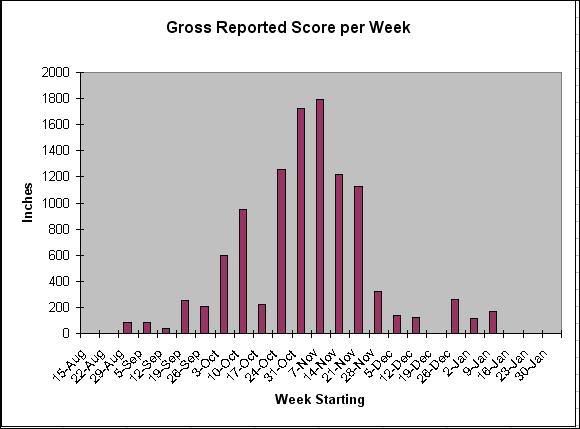
This first plot shows the Total Inches reported on a weekly basis (either the stated harvest date was used, or the posting date if the harvest date was not provided). You can see the "October Lull"...
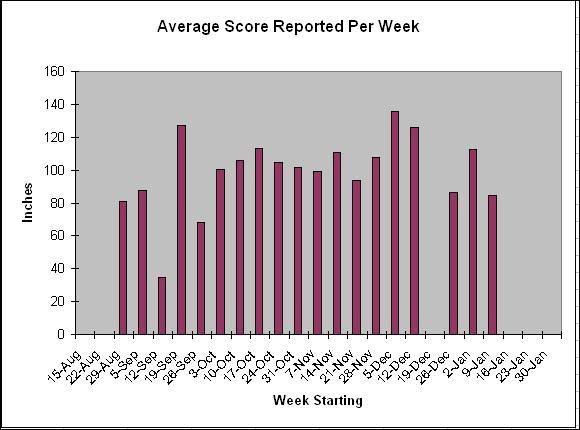
This next plot shows the average buck scorereported on a weekly basis. No one week stands out; note thatthe data averages in Sept and Janare based on smallsample sizes. The overall average of all bucksis ~100 inches.